

Your ticketing platform counts sold tickets. We predict who's actually going to show up.
Stop flying blind. The Soundwave Analytics Engine easily integrates with any major ticketing platform, instantly transforming your ugly raw reports into a beautiful, interactive live dashboard—sales velocity, geo-heatmaps, demographic breakdowns, and historical pacing normalized by days-out. Insights your ticketing platform simply can't provide.
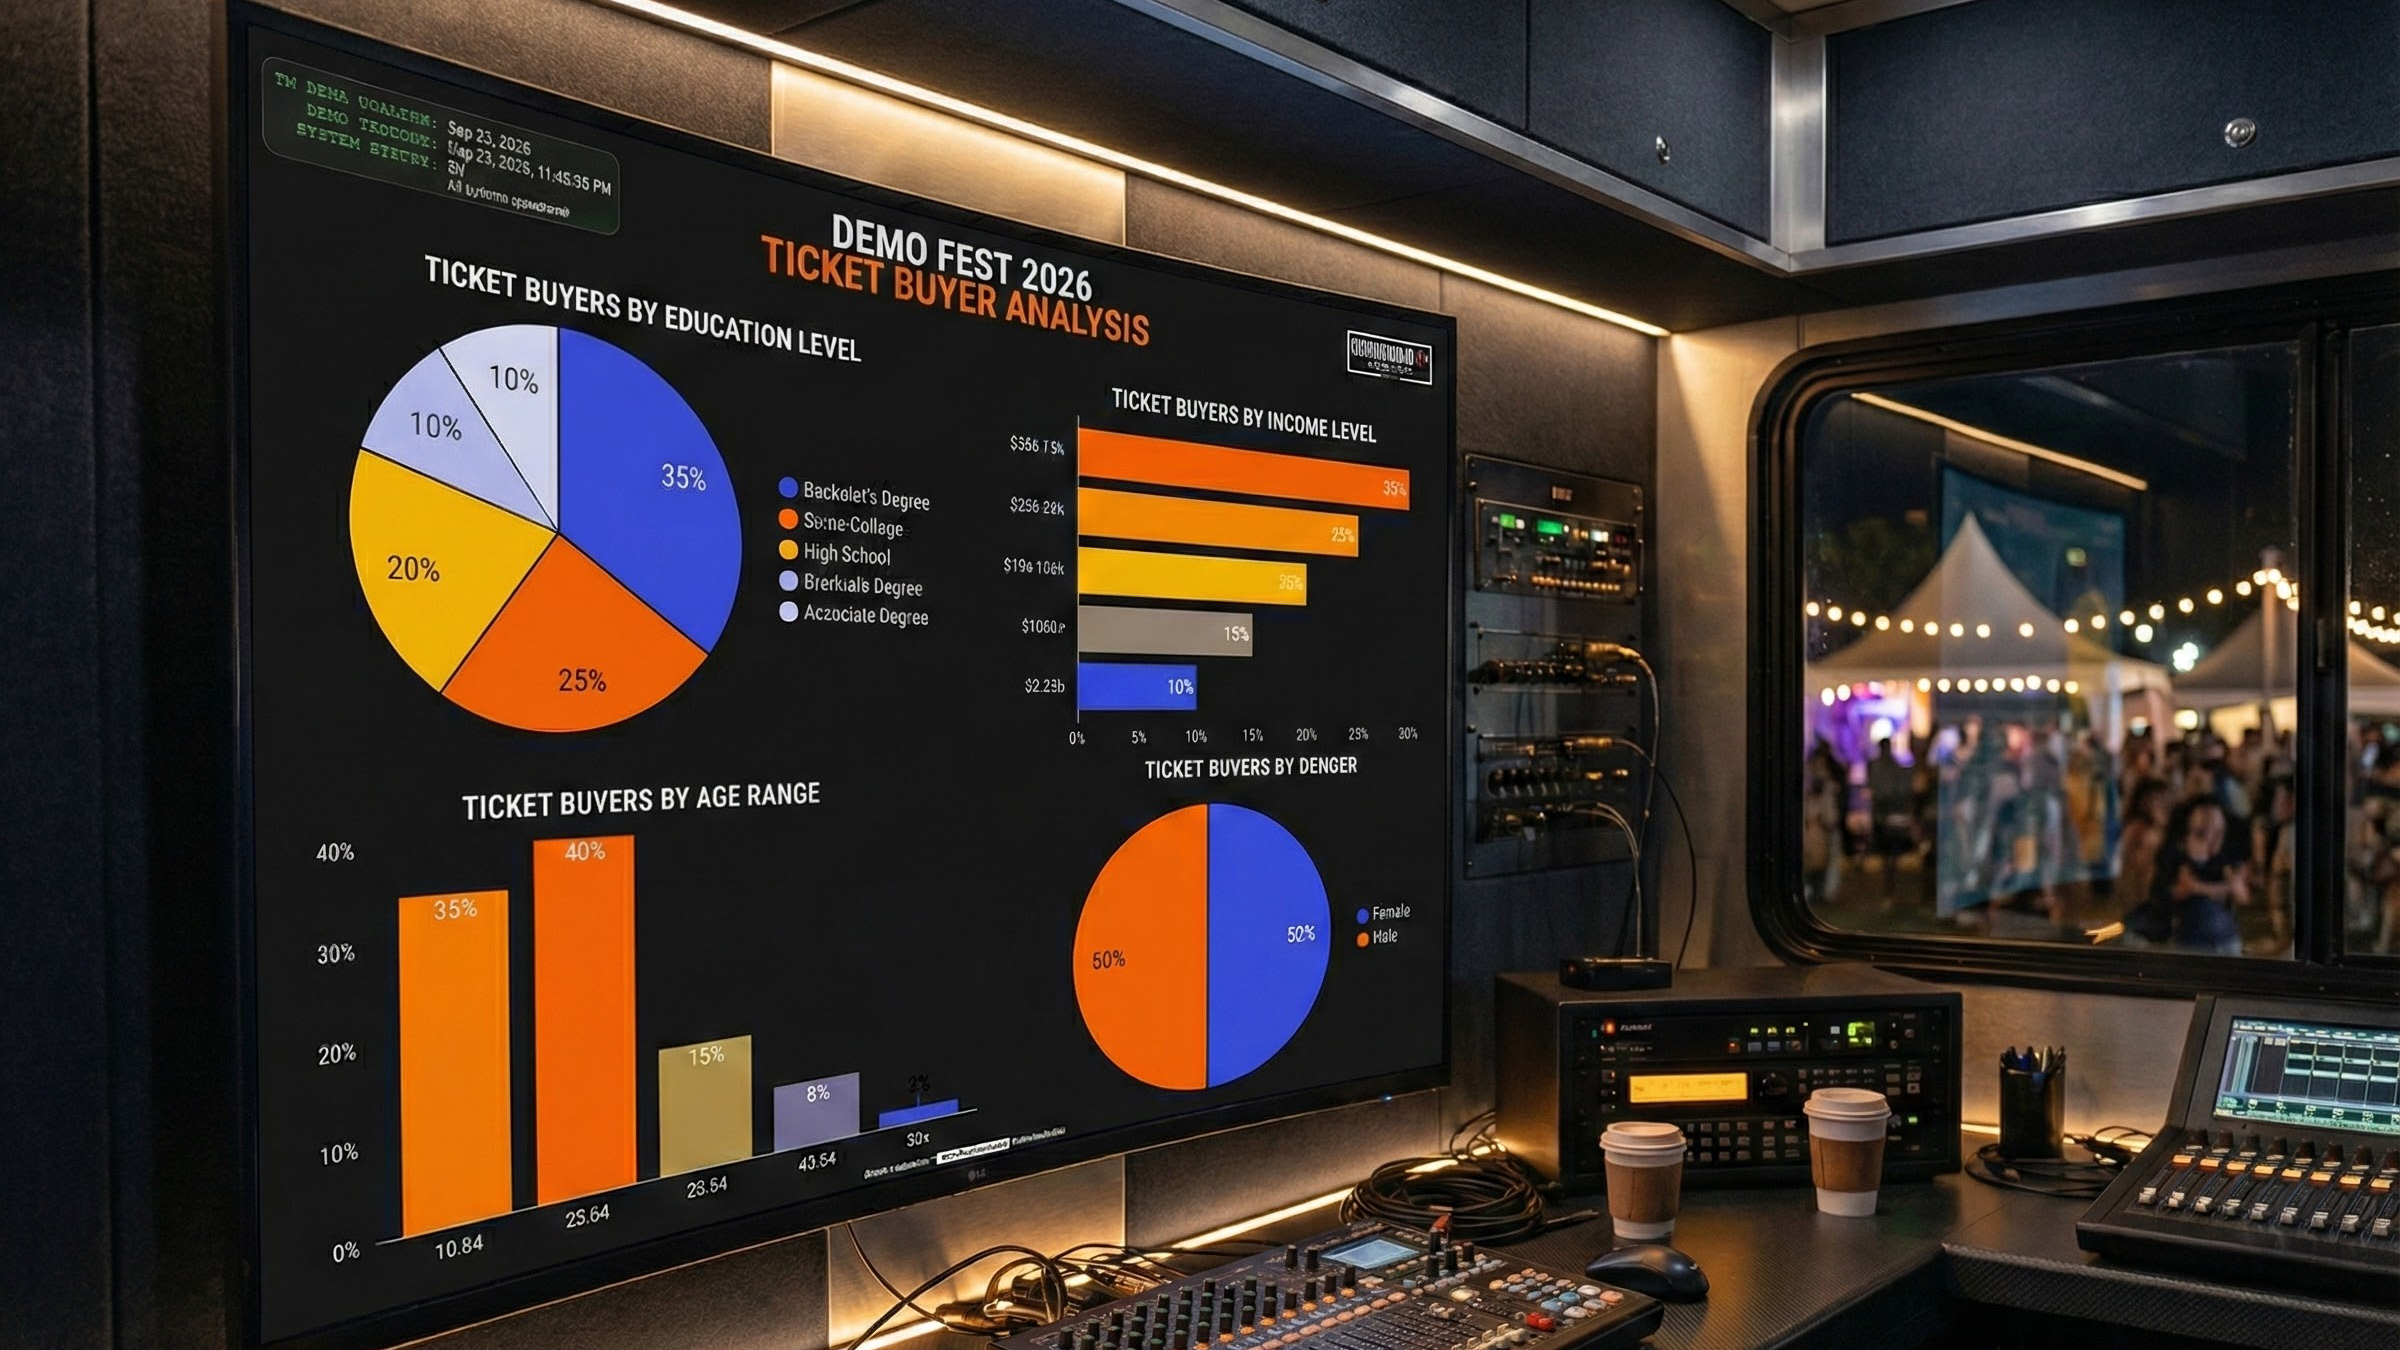
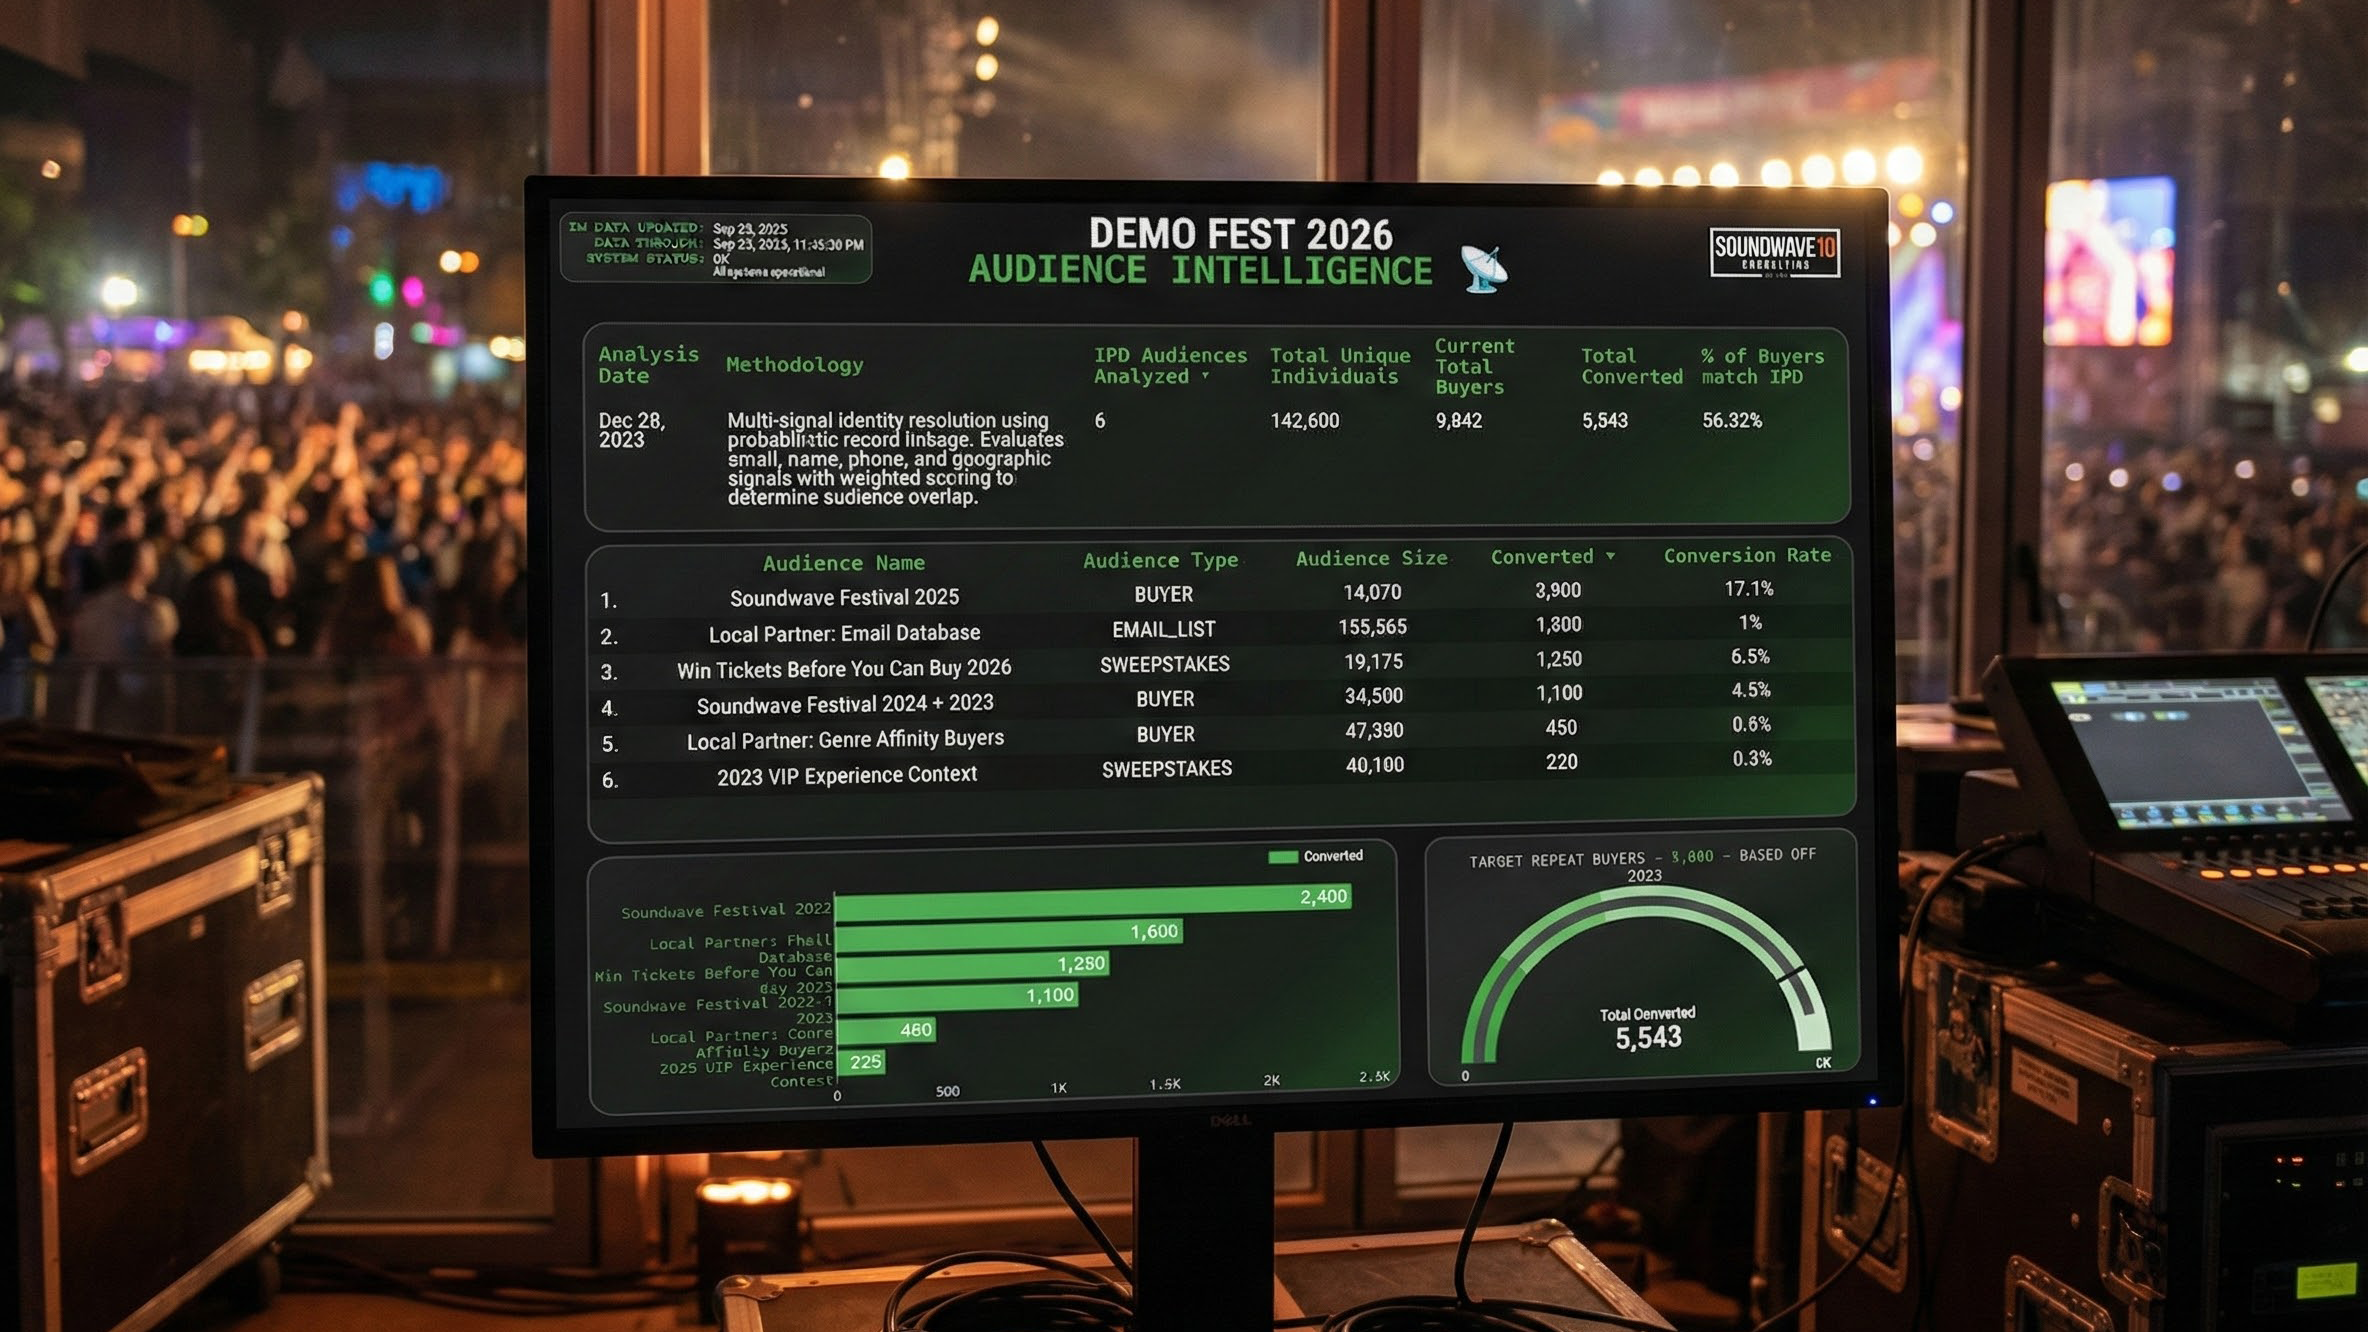
We even integrate your own email lists, phone numbers, previous buyers, & more to give you true Audience Intelligence into who's buying, who's not, how many times they've attended, and what they've spent—updated daily.
Built by a team of marketing & advertising experts, refined by processing over $100M in ticket revenue for events just like yours, & battle-tested to produce results.
Compatible with all major ticketing platforms
Compatible with
all major ticketing platforms
Ticketmaster • Front Gate • Eventbrite • AXS • See Tickets • Tixr • DICE
Soundwave Consulting is an independent analytics provider and is not affiliated with, endorsed by, or sponsored by any ticketing platform. All data processing is performed on reports legally provided by the client as the data owner.

SOUNDWAVE ANALYTICS ENGINE
We don't just automate your ticketing reports—we transform them. Historical trends, velocity tracking, geographic breakdowns, and integration with your own audience data to unlock insights the raw reports can't show you.
We continuously normalize inconsistent data headers and merge fragmented Event IDs behind the scenes, ensuring your reporting pipeline never breaks due to a ticketing schema change. It's like having a dedicated data engineer monitoring your stack 24/7, for a fraction of the cost.
Whether you're running stadium shows, amphitheater tours, or multi-day festivals, our system adapts to your event portfolio's complexity and delivers actionable intelligence straight to your inbox, every day.

Unified Event
Command
Tired of your ticketing platform fragmenting your festival into 12 different "Event IDs" just for different ticket tiers? We ingest the chaos and output clarity. We auto-unify every ticket type into one comprehensive "Unified View."

Self-Healing
Metadata
Daily trend reports fail. Platforms glitch. Data gaps appear right before your stakeholder meeting. Our defensive engine detects gaps and instantly reconstructs the truth from raw order logs.

Automated Daily
Analytics
Stop manually exporting ticketing reports every morning. We ingest the daily data drop automatically, calculating your day-over-day velocity and sell-through trajectory so your morning report is ready before you are.
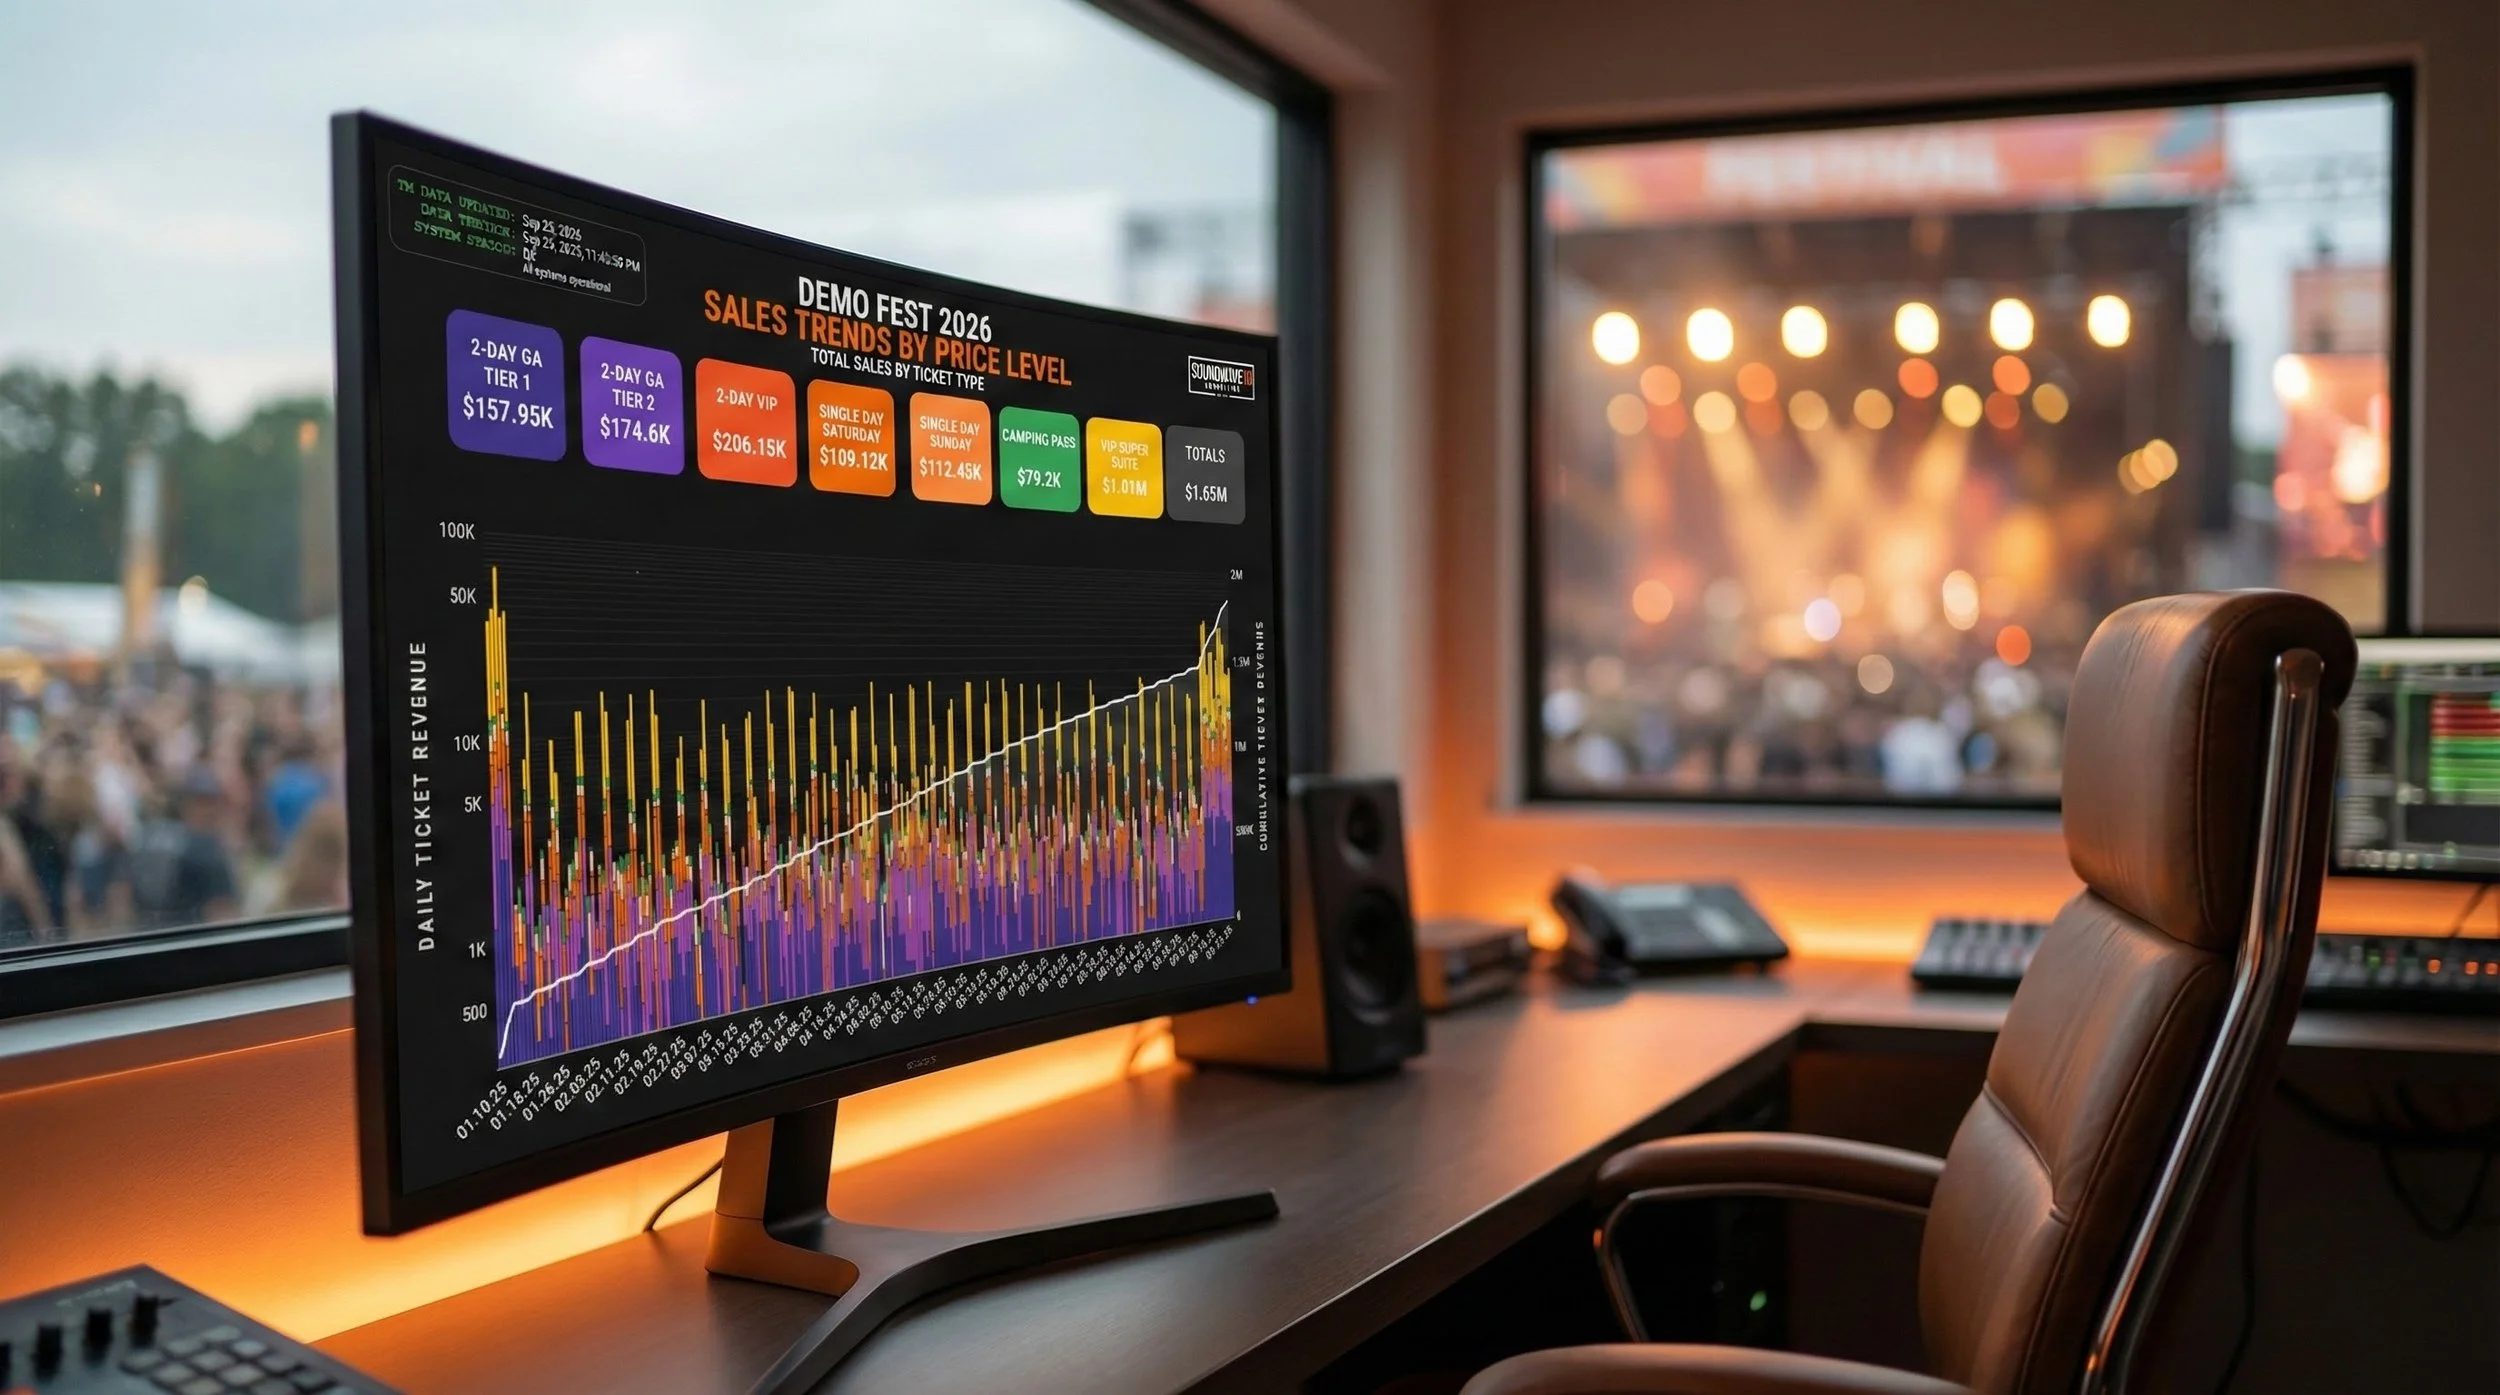
Daily Velocity Tracking
Watch ticket sales by tier every morning. Spot trends, identify slowdowns, and react before it's too late.
Geographic Intelligence
See exactly where tickets are selling — by city, state, and country. Know where to double down on marketing.
Daily Auto-Refresh
Data pulls automatically from your ticketing platform every single day. Zero manual work required.
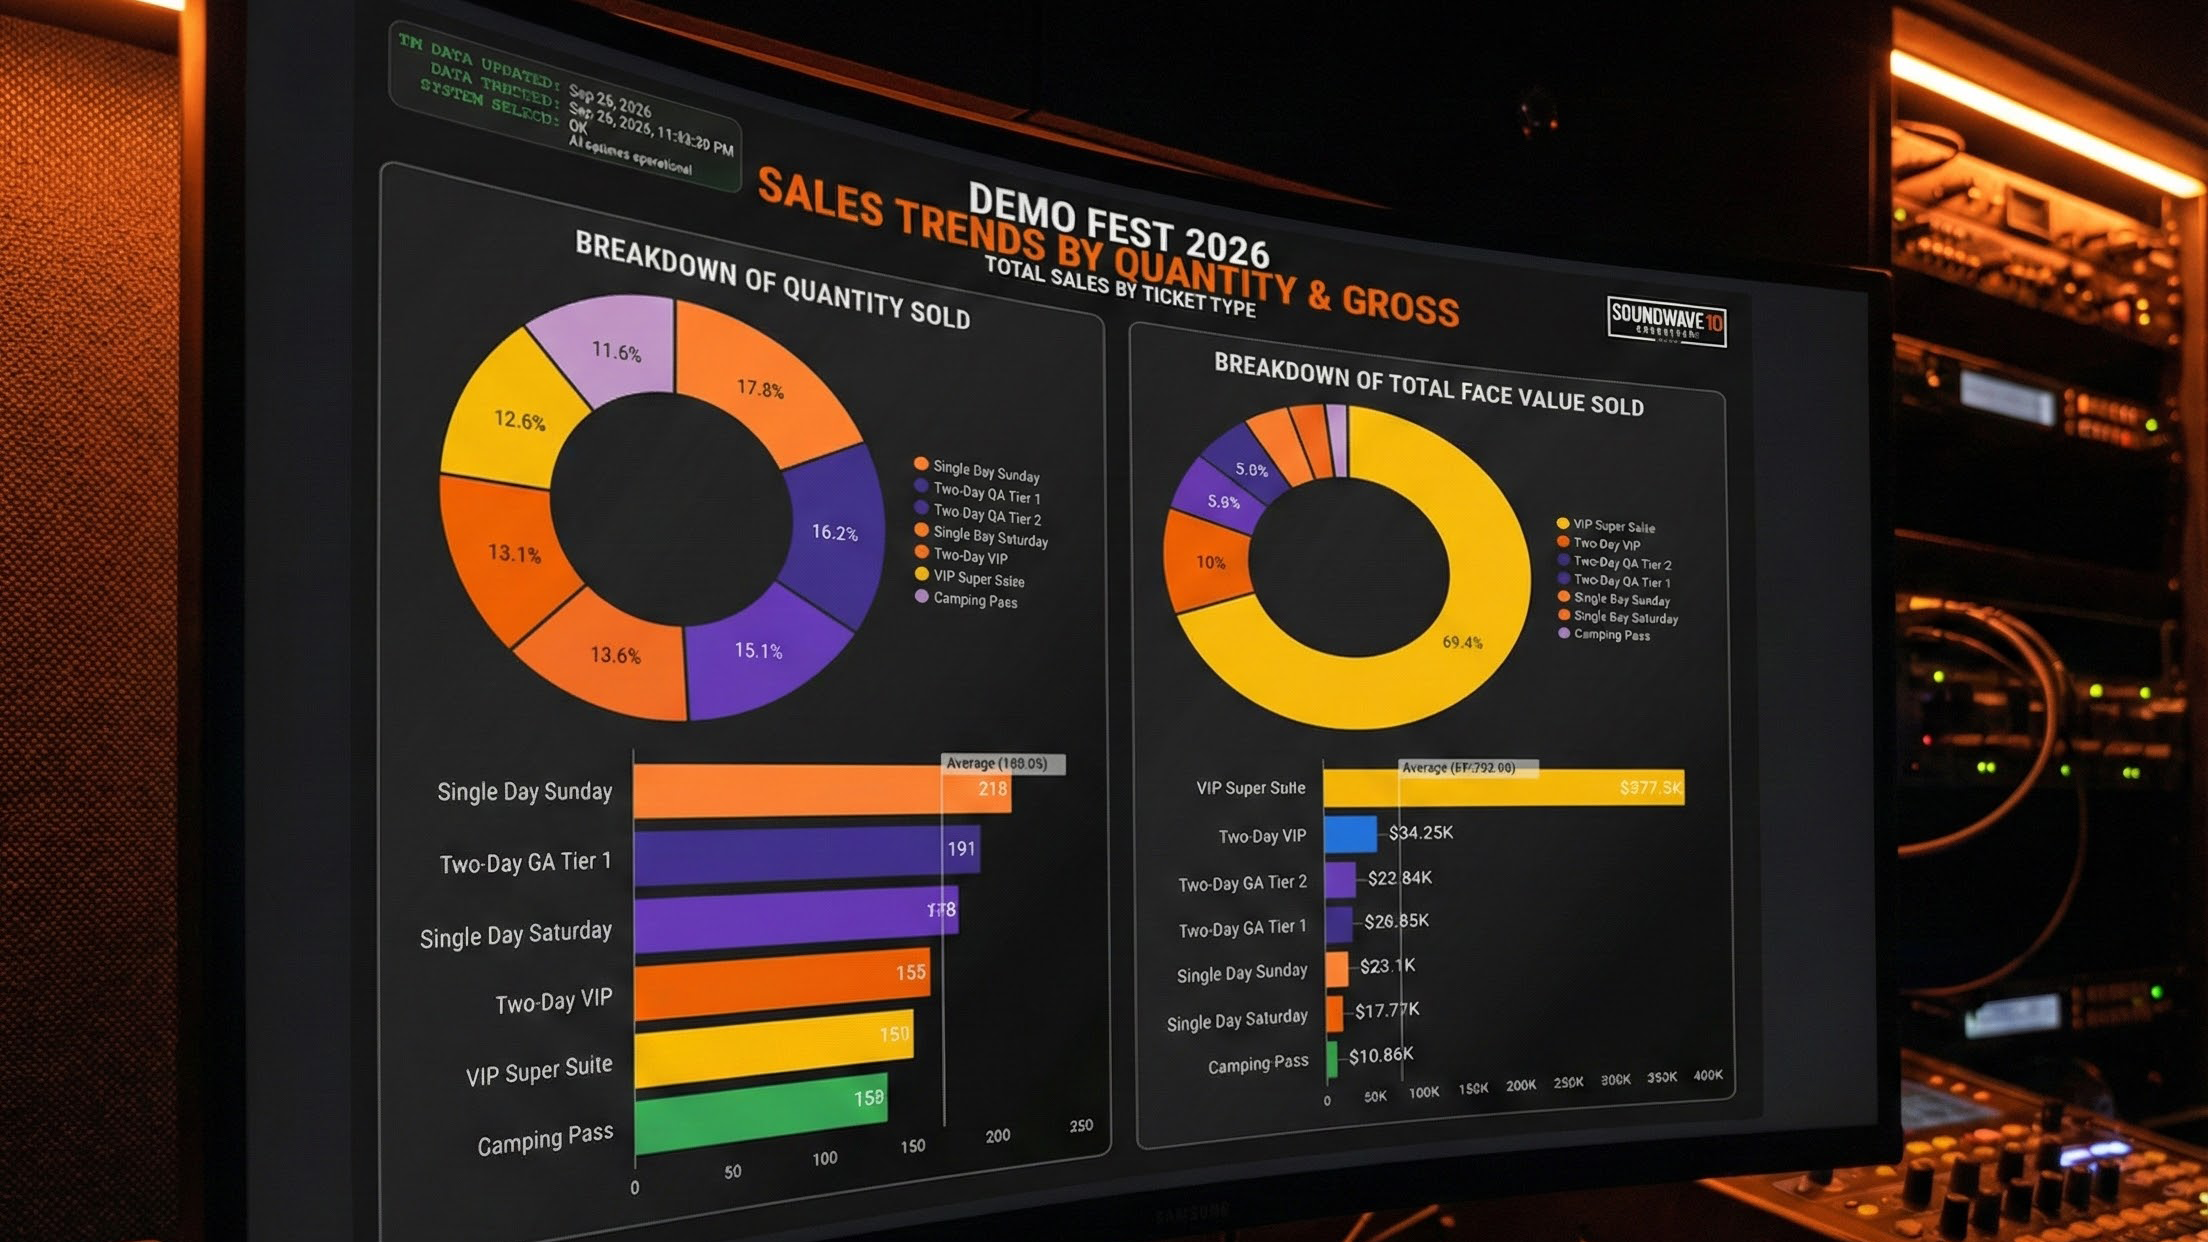
Revenue Breakdowns
Gross revenue by ticket type, face value analysis, and quantity trends — all visualized clearly.


Take the Engine for a Test Drive
For the full interactive demo, please view on Desktop.
Daily Auto-Ingest
Simply add our system email to your ticketing report distribution list. Reports arrive automatically—no APIs to manage, no complex setup.
Normalize & Transform
Our engine parses raw files using self-healing metadata to merge disparate streams into one golden schema dataset.
Live Looker Dashboard
Your Looker Studio dashboard updates automatically every morning. See trends, adjust spend, drive sell-through.
Need More?
Want to unify your Meta & Google ad spend with ticket sales? Need Google Analytics integrated into your dashboard? Looking to reconcile accounting data or connect any platform with an API?
We build fully custom analytics solutions tailored to your exact needs.
If it has data, we can visualize it.
Request a Custom QuoteSee Your Data In Action
Schedule a demo and let us show you what your festival data could look like.