

Stop Guessing. Start Knowing.
Tour analytics that aggregate every platform, compare to your historical plays, and give you intelligence no ticketing platform provides.
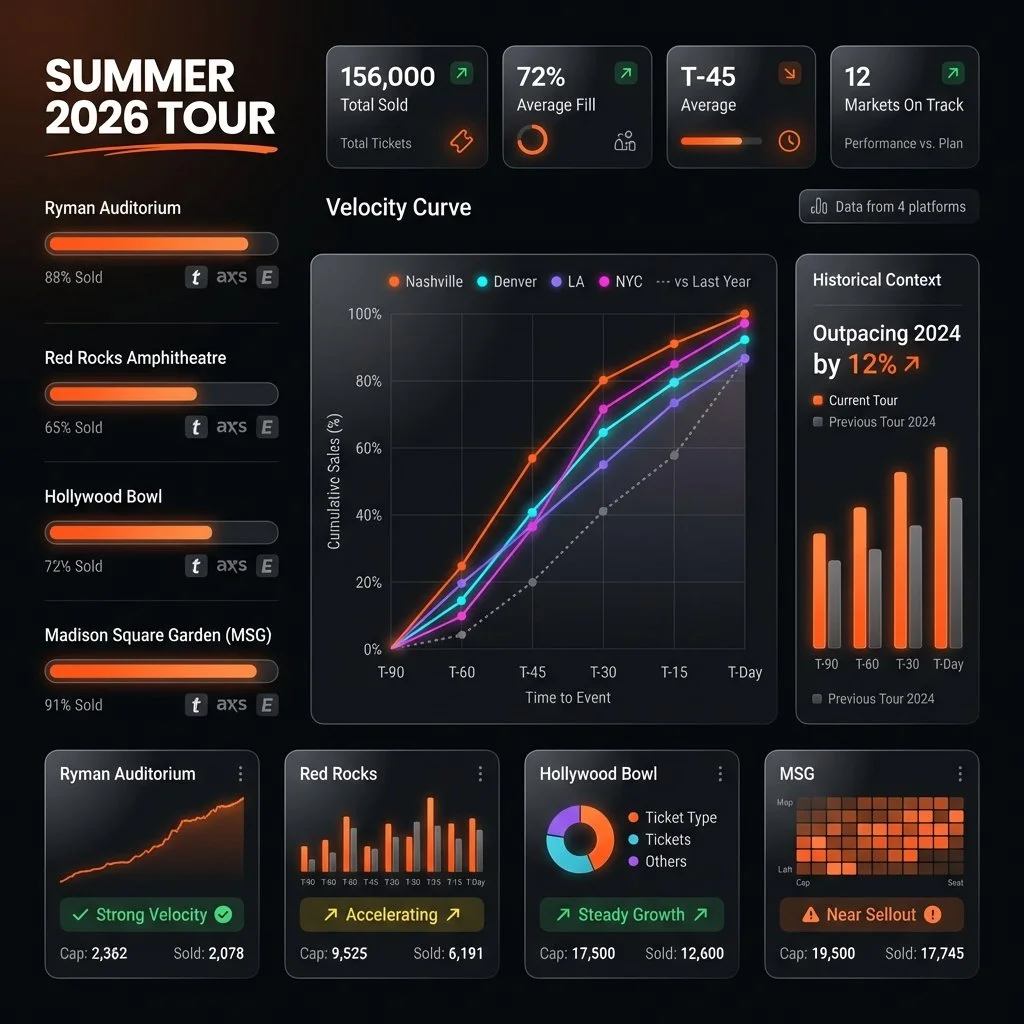
Tours Are Blind Operations—Until Now
Every booking agent faces the same nightmare: fragmented data, no historical context, and zero cross-platform intelligence.
One Dashboard. Every Show. Every Market.
Finally see your entire tour the way you think about it—with historical context and intelligence that actually helps.
Intelligence Built on Real Data
Not projections. Not industry averages. Actual performance data from real tours at real venues.
Years of Archives
Historical ticket counts extracted from booking agent emails. Your institutional knowledge, finally captured.
Shows Analyzed
Venue-by-venue data. Know exactly what "good" looks like before you even announce.
Automatic Backfill
Set it and forget it. Our system parses any format and keeps your historical database growing.
Get Your Dashboard in 48 Hours
No IT project. No API integrations. Just forward some emails.
Tell Us Your Tour
Dates, venues, platforms. Takes 5 minutes. We handle everything else.
CC Us on Reports
Have promoters CC analytics@soundwave.com on daily counts. That's the entire "integration."
Access Anytime
Live dashboard updates daily. Desktop, mobile, shareable with your whole team.
Simple, Transparent Pricing
Monthly subscription. No show limits. Your whole team gets access.
All plans include unlimited team members, cross-platform aggregation, and historical comparisons.
Starter
For artist managers and independent tours
- Multi-platform aggregation
- Live Looker dashboard
- Historical comparisons
- Unlimited shows
- Email support
Professional
For touring artists with multiple runs
- Everything in Starter
- Velocity projections
- Custom branding
- Priority support
- Onboarding call
Agency
For booking agencies with multiple artists
- Everything in Pro
- Portfolio dashboard
- Cross-artist analytics
- White-label option
- Dedicated manager
🎉 Launch Special: First month free for early adopters
Built on a Decade of Live Event Data
10M+
Tickets Tracked
500+
Shows Analyzed
50+
Venues Mapped
10yr
Historical Data
Frequently Asked Questions
What ticketing platforms do you support?
Ticketmaster, AXS, Eventbrite, SeeTickets, Tixr, DICE, and Front Gate Tickets. If your promoter uses something else, we can usually add support within 48 hours.
How do we send you the data?
Your local promoters add analytics@soundwave.com to their daily ticket count recipients. That's it. No API, no file uploads, no IT project. We parse Excel, CSV, and PDF attachments automatically.
What's included in historical comparisons?
We compare your current tour to your previous plays at the same venues. You'll see how you're pacing vs. last time, typical sell-through curves, and seasonal patterns.
Who owns the data?
You do. Soundwave owns the infrastructure, but you and your team have full access to export, share, or revoke access anytime.
Can we add team members?
Unlimited viewers on all plans. Add your artist manager, tour accountant, promoters—anyone who needs visibility. No per-seat fees.
What if promoters use different platforms?
That's exactly what we built this for. Ticketmaster in Nashville, AXS in LA, Eventbrite in indie markets—all normalized into one unified dashboard.
Get Your Dashboard Before Announcement
Summer 2026 tours are booking now. Get ahead with analytics that actually help you sell.
Prefer a call? Book a 15-min demo